Thanos
Thanos: Prometheus at Scale! - DevConf.CZ 2020 Youtube video
“Running a product without any monitoring is like NOT running the product at all”
Its useless to run a 24 hrs working system if we can’t prove that its actually working - proving using monitoring tools
Prometheus needs to scale out..
Why multiple Prometheus Instances?
What if the Prometheus node dies and it can’t scrape and no querying is happening… Or maybe I want to switch to another Prom server or do a rolling update without any downtime
In these cases, we need a highly available Prometheus Server/Instances (multiple replicas)
- Functional Sharding → separate prometheus for scraping each namespace
- Consistent Hash Sharding → telling prometheus that how many prometheus instances/servers are running so that it equally divides the app load for metric scraping
So but what if we have multiple clusters? We will surely need more than one Prometheus.
Question: Why can’t we have one Prometheus server that collects data from multiple clusters?
Answer: Not recommended. Because the pool model should be in the same failure domain & same network as your services that it monitors.
Prometheus doesn’t work like a distributed application/system. So there are some scaling out challenges.
Challenges when faced when we have multiple Prometheus server:
- Firstly, the datastore are not replicated for multiple clusters. So each data should be queried individually from each Prometheus service/server → No global view. Global aggregation is not possible
- Another issue we can face for multiple Prometheus servers in one node for a specific service is that it could miss some metrics in a time series but both of them can be different. One prometheus can miss a metric from A time series and the other Prometheus can miss a metric from B time series and vice versa. We need HA to solve this. Not just scraping but in querying as well
- Typically Prometheus has a really short time range for data. Retention. For example set up a data retention rule that will keep the data in the Prometheus Database for 15 days then make it fall out. But what if we want to look at long term data for example from last year? If I keep all these data in my disk, this will be really hard to maintain Prometheus data for such long retention times.
So far summary:
- Monitoring is essential
- Monitoring is easy with Prometheus
- We often have to run more than one Prometheus → HA or to manage the load
- Using distributed Prometheus brings some challenges
- Unlimited retention of metrics has some challenges
All the above challenges can be solved using the tool known as Thanos. Thanos is only focused in simplicity and low maintanence. Exists just to scale Prometheus.
- Global Query View
- HA
- Long term Storage
So how to enable Thanos on multiple Prometheus in Seven Steps:
- Step 1: Add a Thanos sidecar to each Prometheus. It is a small GO binary that has some features. Need this added to each Prometheus.
- Step 2: Add stateless Thanos Querier. It essentially performs PromQL evaluation in Global level. It connects to storeAPI via gRPC protocol. The Querier has a built-in deduplication layer. For each of the replicas of Prometheus (using replicalabels), it detects missing data for each replica and & fills it accordingly.
- Long-Term Retention: Thanos sidecars get credentials for object storage. When prometheus outputs a block in its TSDB, the Thanos Sidecar uploads that to the object storage. Now to actually use this data, we need a new Thanos Component called Thanos Store Gateway. Instead of reading the data from Prometheus API, it reads from Object storage. So recent data is from Thanos sidecars, long term is from Storage Gateway. But there is a slight issue with this as the long term data could be over millions. So here comes the Thanos Compactor. It does the downsampling (high resolution to low resolution data). Other thing is that it combines multiple Prometheus TSDB blocks to fewer larger blocks. E.g: Many 2 hours TSDB blocks to few Longer hour TSDB blocks.
So what is a storeAPI?
- Every component in Thanos serves data via gRPC StoreAPI
sidecar mode
receive mode
external label
global:
  external_labels:
     cluster: <cluster 명> ## alert rule 등을 구성할 때에도 사용 가능
thanos query
thanos query frontend
thanos compactor
Downsampling
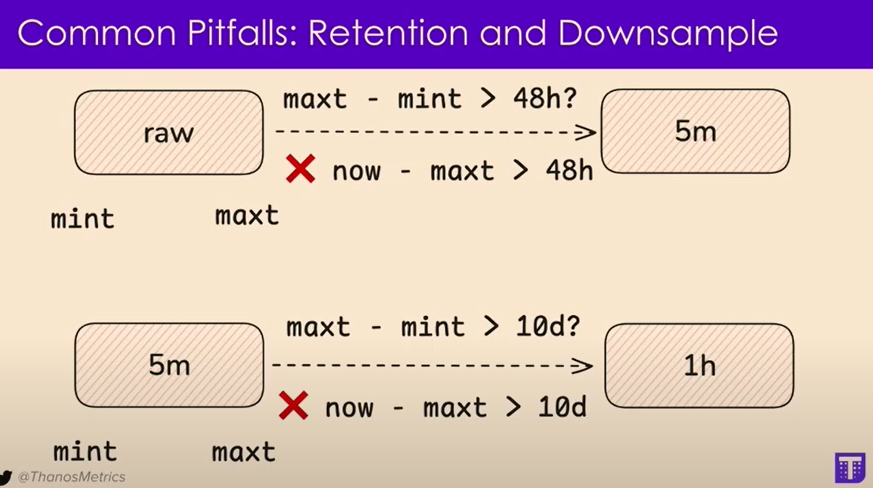
Downsampling is the process of reducing the resolution of metric data over time to save storage space and improve query performance. In Thanos, downsampling is achieved by aggregating the original high-resolution data into lower-resolution data points. Thanos supports three levels of downsampling:
- 5-minute resolution: The highest level of downsampling that Thanos performs, which aggregates data points into 5-minute intervals.
- 1-hour resolution: The intermediate level of downsampling, where data points are further aggregated into 1-hour intervals.
- Raw resolution: The original high-resolution data points collected by Prometheus.
The primary purpose of downsampling is to strike a balance between retaining detailed data for recent metrics and reducing the storage footprint for older data, which typically does not require as much detail. Queries for recent data use higher resolution (raw or 5-minute), while queries for older data use lower resolution (1-hour) for efficiency.
Compaction
Compaction in Thanos refers to the process of consolidating smaller blocks of metric data into larger blocks. This serves multiple purposes:
- Reducing the number of blocks: Smaller blocks are merged into larger ones to reduce the overall number of blocks stored. This helps in reducing the overhead associated with managing many small files and improves query performance.
- Data deduplication: During compaction, Thanos can also perform data deduplication, ensuring that redundant data points (typically from multiple Prometheus servers) are removed.
- Retention of downsampled data: Compaction helps in retaining the downsampled data while discarding or merging the raw data according to the retention policies. This way, it manages the data lifecycle effectively.
The compaction process in Thanos is managed by the thanos compact component, which runs periodically to identify blocks that need compaction and performs the necessary merging and downsampling.
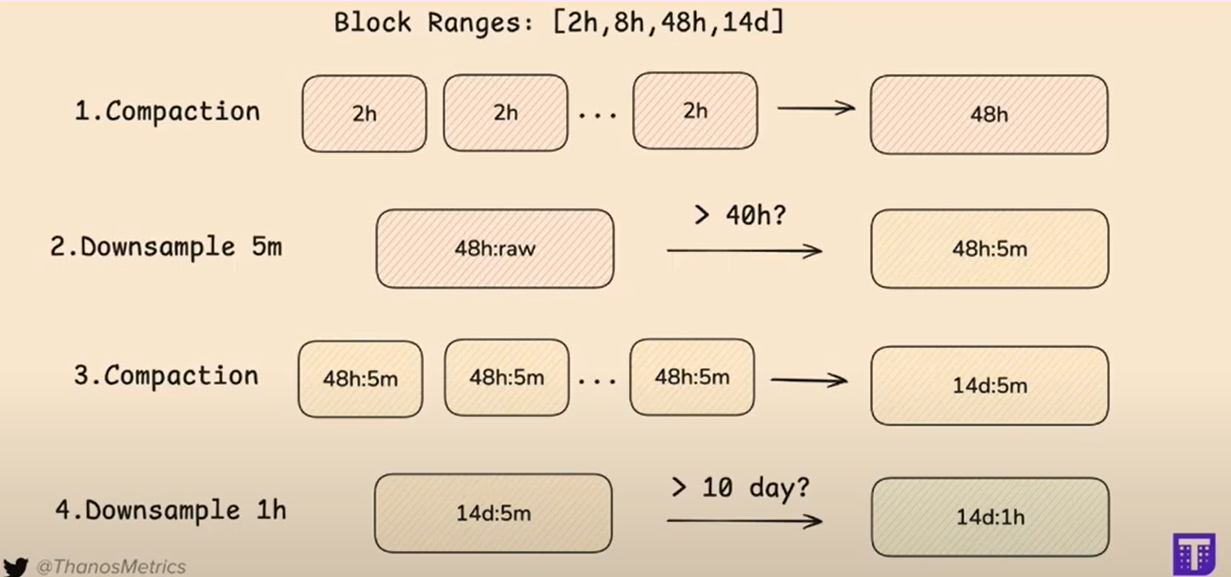
How These Processes Work Together
- Initial Data Ingestion: Prometheus instances collect and store high-resolution metric data in blocks, which are then uploaded to an object storage (e.g., S3, GCS) by Thanos sidecars.
- Compaction: The
thanos compactcomponent periodically runs to merge smaller blocks into larger ones and perform downsampling as configured. - Querying Data: When a query is made, Thanos Querier intelligently selects the appropriate resolution (raw, 5-minute, or 1-hour) based on the time range and resolution required. Recent data queries use raw or 5-minute resolution, while older data queries use 1-hour resolution to improve performance.
By combining downsampling and compaction, Thanos ensures that metric data is stored efficiently and remains accessible for both short-term and long-term analysis, providing a scalable solution for monitoring large-scale systems.
Regarding Compactor
Compaction occurs in the following steps (in order)
- Compaction
- Downsampling
- Retention
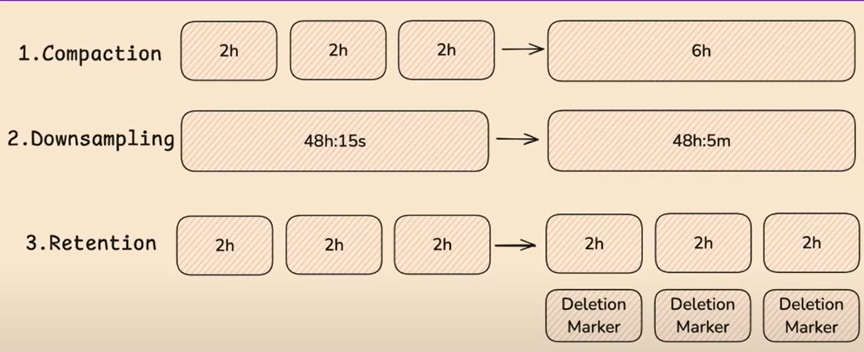
So if Compaction hasn’t completed, Downsampling won’t occur & vice versa.
Troubleshooting the compactor (if theres a bottleneck - slow queries)
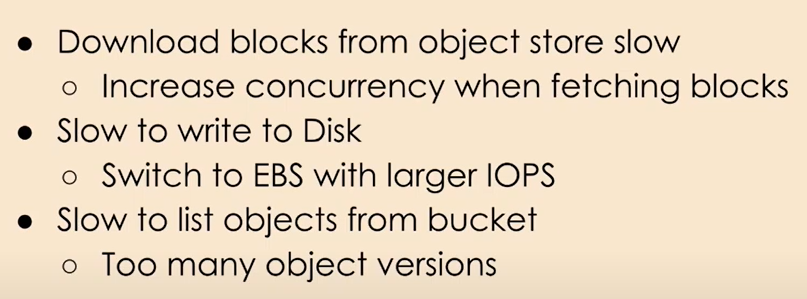
https://thanos.io/tip/operating/compactor-backlog.md/
Important thing to remember
Calculate Size for PVC & Obj Storage in Thanos
To calculate the PVC size for thanos compactor
We have the following formula (from Cortex)
min_disk_space_required = compactor.compaction-concurrency * max_compaction_range_blocks_size * 2
(Search in cortex docs regarding this → #compactor-disk-utilization)
For the Object storage we can always get the biggest block data from thanos bucket (14 days block for Thanos by default)
Then add all the data sizes for all the resolutions (raw, 5m & 1h)
Then divide by 14 to get 1 day data
Then multiply by 30 to get 1 month data (depends on the situation)
Also it depends on the retention period of all of the resolution sizes.